A repository for useful data visualization and analysis tidbits.
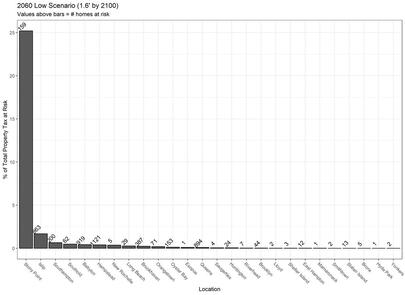
NYS Property Tax Revenue at Risk due to Chronic Flooding from Sea Level Rise
- There is anecdotal information that municipalities (i.e., villages, towns, cities) are opposed to participating in voluntary buyouts (i.e., property acquisition) as a flood mitigation approach because of the perceived loss of property tax revenue that would occur.
- It is unclear to what extent the property tax revenue of municipalities in New York state is at risk to flooding.
- This analysis attempts to answer: If coastal municipalities in New York state were to offer voluntary buyouts to the properties most at-risk to chronic inundation, how would the municipal tax revenue be impacted?
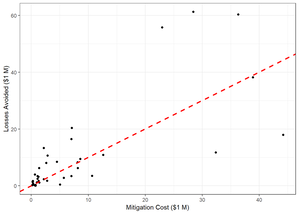
Cost-Effectiveness of Property Acquisition for Flood Mitigation
- This analysis attempts to answer: Are property acquisitions a cost-effective flood mitigation strategy? Property acquisitions are also known as voluntary buyouts and are a component of managed retreat from flood prone areas.
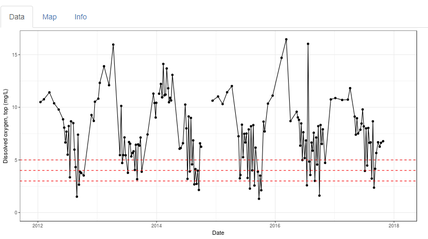
Visualizing New York Harbor Water Quality
- This web app (created in R Shiny) allows you to visualize NY Harbor water quality data collected by the New York City of Department of Environmental Protection.
- Users can select parameters (oxygen, fecal coliform, enterococcus), sites, and time span (2012-present).
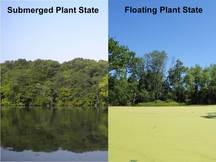
Simulation models of aquatic vegetation
- This is a spatially- and temporally-explicit simulation model of interactions between floating plants and submerged plants in freshwater lakes that I have developed as part of my dissertation.
- These interactive apps are made with the R package shiny and the content is hosted on Amazon Web Services.
- With the app, you can view the results of different parameterizations for simulation scenarios including different water body sizes and shapes, growing season lengths, and species compositions. (NOTE: Apps are no longer hosted on the web)

Make a Twitter Bot with R
- Every wanted to make a Twitter Bot that automatically tweets out random thoughts?
- Thanks to this tutorial from Automated Data Collection, it's never been easier.
- You can follow my creation: @TacoBot2000 which randomly tweets out names for new Mexican foods.
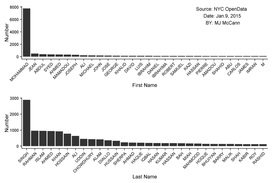
Most Common Taxi Driver Names in NYC
This tutorial uses data from NYC OpenData to show you how to:
This tutorial uses data from NYC OpenData to show you how to:
- download data directly from the web,
- do some basic clean-up and processing of text strings, and
- make some nice plots with the R package ggplot2.
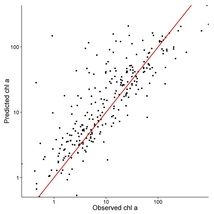
Machine Learning & National Lakes Assessment Data
- Two of my favorite things: lakes and statistics!
- Can we predict the amount of chlorophyll a in a lake with other variables measured during a survey?
- We'll use data from the US EPA National Lakes Assessment and a machine learning algorithm, Random Forests.
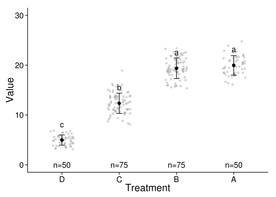
Data Visualization: Raw & Summary Data
- Don't hide your messy data behind tidy standard error bars!
- Fess up about those sample sizes!
- Display both your raw data and summary statistics on the same plot.
- A short demo that I made with R Markdown.
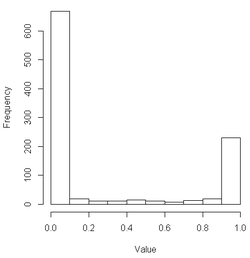
Probability Distributions
- Gamma, Beta, Poisson??? Not everything is Normal!
- Ever wondered what all of those weird-sounding statistical distributions look like?
- Here is a shiny app where you take a random sample and look at some of the statistical properties of each probability distribution.
- Code available on GitHub.
